
D1 January 2006 Q3
3.
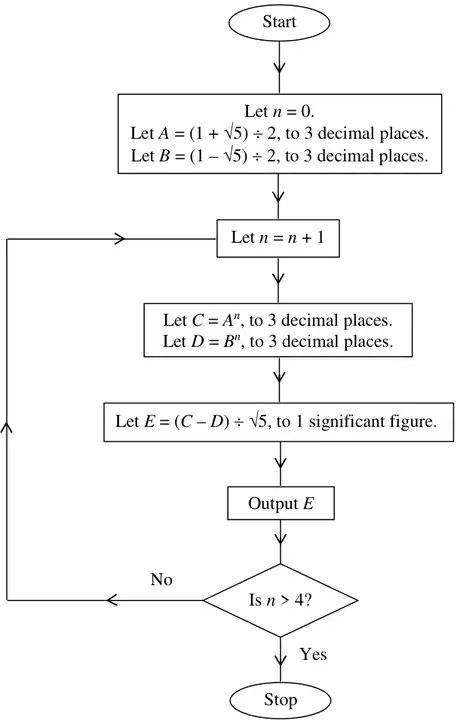
An algorithm is described by the flow chart shown in Figure 3.
(a) Complete the table in the answer book recording the results of each step as the algorithm is applied.
(Notice that values of \(A\), \(B\), \(C\) and \(D\) are to be given to 3 decimal places, and the values of \(E\) to 1 significant figure.)
(8)
(Notice that values of \(A\), \(B\), \(C\) and \(D\) are to be given to 3 decimal places, and the values of \(E\) to 1 significant figure.)
| \(A\) | \(B\) | \(n\) | \(C\) | \(D\) | \(E\) |
|---|---|---|---|---|---|
(b) Write down the output from the algorithm. (1)
| Scheme | Marks | ||||||||||||||||||||||||||||||||||||
|---|---|---|---|---|---|---|---|---|---|---|---|---|---|---|---|---|---|---|---|---|---|---|---|---|---|---|---|---|---|---|---|---|---|---|---|---|---|
| M1 A1 A1 (3) M1 A1ft A1ft A1 A1 (5) | ||||||||||||||||||||||||||||||||||||
| (8) |
| Scheme | Marks |
|---|---|
| Output: 1, 1, 2, 3, 5 | A1ft |
| (1) | |
| (9 marks) |