
D1 January 2012 Q6
6.
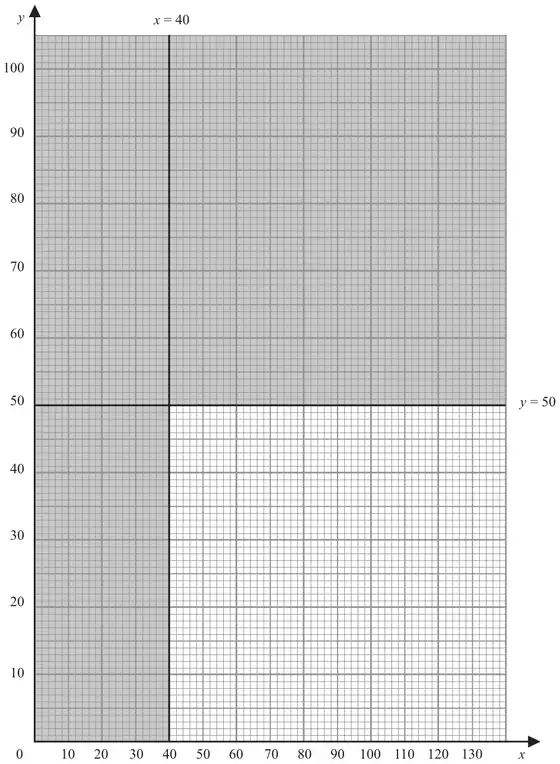
Edgar has recently bought a field in which he intends to plant apple trees and plum trees.
He can use linear programming to determine the number of each type of tree he should plant.
Let \(x\) be the number of apple trees he plants and \(y\) be the number of plum trees he plants.
Two of the constraints are
\[\begin{aligned}x &\geqslant 40\\ y &\leqslant 50\end{aligned}\]These are shown on the graph in Figure 6, where the rejected region is shaded out.
Two further constraints are
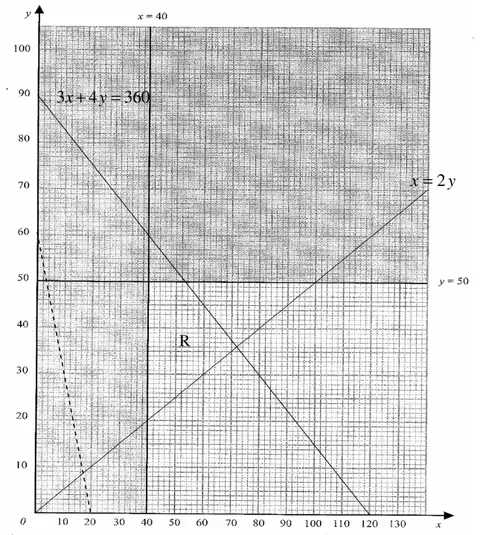
\[\begin{aligned}3x + 4y &\leqslant 360\\ x &\leqslant 2y\end{aligned}\]Edgar will make a profit of £60 from each apple tree and £20 from each plum tree. He wishes to maximise his profit, P.
| Scheme | Marks |
|---|---|
| (Edgar should plant) at least 40 apple trees. (Edgar should plant) at most 50 plum trees. | B1 |
| (1) |
Notes
a1B1: CAO, both. Must be \(\leqslant\) and \(\geqslant\) not < and >.
| Scheme | Marks |
|---|---|
 | B1 B1 B1ft B1 |
| (4) |
Notes
b1B1: \(3x + 4y = 360\) CAO. If extended it must go axis to axis within one small square. Must be long enough to form the correct feasible region. Lines should be drawn with a ruler.
b2B1: \(x = 2y\) If extended must go through (0,0) and (120, 60) within one small square. Must be long enough to form the correct feasible region. Lines should be drawn with a ruler.
b3B1ft: ft their lines for correct shading on one of their lines. Implicit if R is correct.
b4B1: Region R correct, CAO. Must be labelled.
| Scheme | Marks |
|---|---|
| (P = ) \(60x + 20y\) | B1 |
| (1) |
Notes
c1B1: CAO
| Scheme | Marks |
|---|---|
| Drawing objective line | M1 A1 |
| Calculating optimal point | DM1 |
| (72, 36) | A1 |
| (4) |
Notes
d1M1: Drawing objective line or its reciprocal.
d1A1: Correct objective line. Axis to axis (0, 30) to (10, 0) minimum.
d2DM1: Depends on 1st M and correct region. Finding their correct optimal point.
d2A1: CSO
The vertices in R are:
(40, 20) (40, 50) \(\left(53\tfrac{1}{3}, 50\right)\) (72, 36)
| Scheme | Marks |
|---|---|
| (£) 5 040 | B1 |
| (1) | |
| (11 marks) |
Notes
e1B1: CAO