
D1 January 2011 Q6
6.
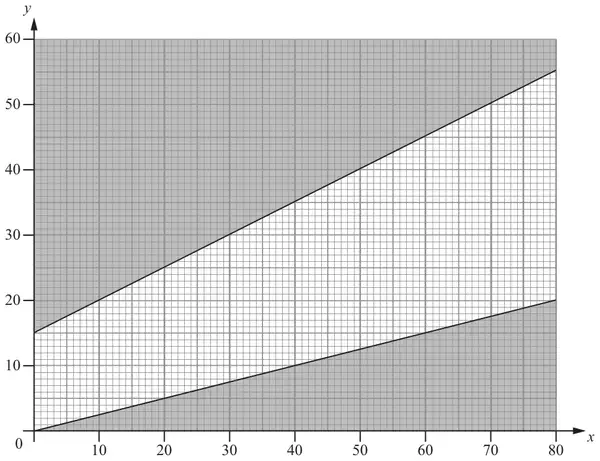
The graph in Figure 6 is being used to solve a linear programming problem.
Two of the constraints have been drawn on the graph and the rejected regions shaded out.
(a) Write down the constraints shown on the graph. (4)
Two further constraints are
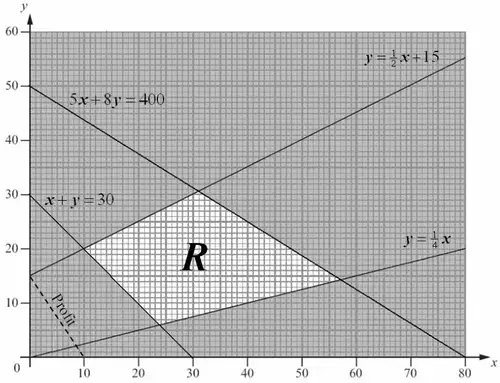
\[\begin{aligned}x + y &\geqslant 30\\ \text{and}\quad 5x + 8y &\leqslant 400\end{aligned}\](b) Add two lines and shading to Graph 1 in your answer book to represent these constraints. Hence determine the feasible region and label it R. (4)
The objective is to
\[\text{minimise }\ 15x + 10y\](c) Draw a profit line on Graph 1 and use it to find the optimal solution. You must label your profit line clearly. (3)
| Scheme | Marks |
|---|---|
 | |
| \(4y \geqslant x\) o.e. | B1 B1 |
| \(2y \leqslant x + 30\) o.e | B1 B1 |
| (4) |
Notes
1B1: ratio of coefficients correct (i.e. equation of line correct)
2B1: inequality correct way round.(\(ay \geqslant bx\) o.e.)
3B1: ratio of coefficients correct (i.e equation of line correct)
4B1: inequality correct way round.
| Scheme | Marks |
|---|---|
| \(x + y = 30\) and \(5x + 8y = 400\) added to the graph | B1, B1 |
| shading correct | B1ft |
| R correct | B1 |
| (4) |
Notes
1B1: \(x + y = 30\) drawn cao
2B1: \(5x + 8y = 400\) drawn cao
3B1ft: shading correct or implied from lines with negative gradient.
4B1: cao
| Scheme | Marks |
|---|---|
| Profit line attempted | M1 |
| Correct profit line | A1 |
| (10, 20) | B1 |
| (3) | |
| (11 marks) |
Notes
1M1: Profit line – intersecting both axes. Minimum (2,0) to (0,3). Accept reciprocal gradient here.
1A1: a correct line
2A1=1B1: cao (e.g not ‘10x + 20y’)