
Higher June 2022 Paper 1R Q19
19 The histogram gives information about the height, \(h\) cm, of each tree in part of a forest.
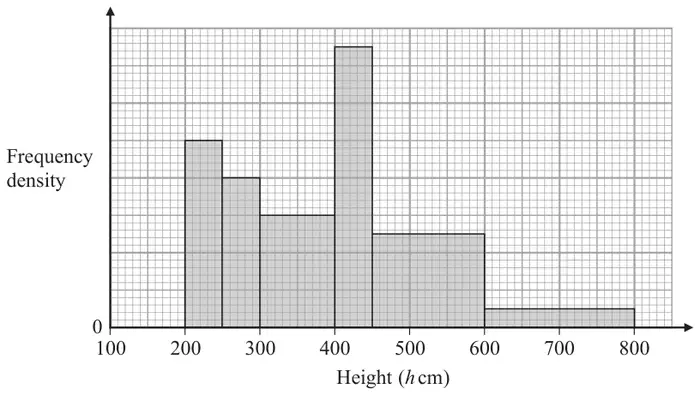
There are no trees for which \(h \leqslant 200\) and for which \(h \gt 800\)
The number of trees for which \(300 \lt h \leqslant 400\) is 8 fewer than the number of trees for which \(400 \lt h \leqslant 500\)
Work out an estimate for the number of trees in this part of the forest that have a height greater than 500 cm.
(3)
| Scheme | Marks |
|---|---|
| eg (7.5 + 2.5) − 6 = 4 large squares represents 8 trees or 5 × 37.5 + 5 × 12.5 − 10 × 15 = 100 small squares represents 8 trees 200 – 250 = 10 250 – 300 = 8 300 – 400 = 12 400 – 450 = 15 450 – 600 = 15 (or 450 – 500 = 5 or 500 – 600 = 10) 600 – 800 = 4 | M1 |
\(5 \times 2 + 2 \times 2\) or \(\dfrac{10 \times 12.5 + 20 \times 2.5}{100} \times 8\) oe or \(100 \times 0.1 + 200 \times 0.02\) | M1 |
| 14 | A1 |
| (3) | |
| (3 marks) |
Notes
M1: oe eg 1 large square represents 2 trees or 12.5 small squares represents 1 tree
or a frequency density axis scale where one large square vertically is FD of 0.04 with no contradictions
or a correct frequency for any bar (could be seen on the diagram)
M1: for a correct method to find the total number of trees greater than 500 cm.