
Foundation June 2019 Paper 2R Q2
2 The pictogram shows information about the number of naan breads sold in a restaurant each day from Wednesday to Saturday.
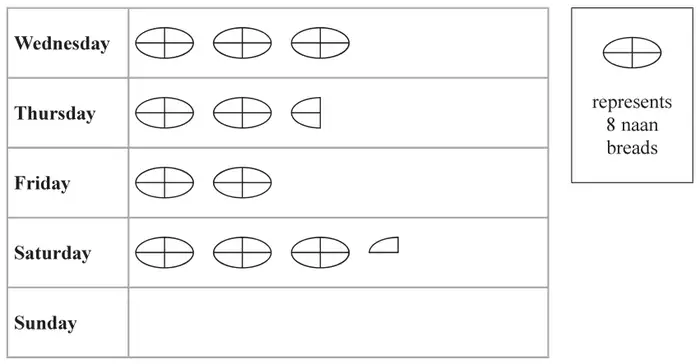
(a) How many naan breads were sold on Wednesday? (1)
More naan breads were sold on Saturday than were sold on Friday.
(b) How many more? (2)
12 naan breads were sold in the restaurant on Sunday.
(c) Show this information on the pictogram. (1)
The manager of the restaurant says,
“More than 100 naan breads were sold in the restaurant from Wednesday to Sunday.”
(d) Is the manager correct?
You must show your working. (2)
You must show your working. (2)
| Scheme | Marks |
|---|---|
| 24 | B1 |
| (1) |
| Scheme | Marks |
|---|---|
| 26 – 16 (= 10) | M1 |
| 10 | A1 |
| (2) |
| Scheme | Marks |
|---|---|
| One and half naan breads drawn | B1 |
| (1) |
| Scheme | Marks |
|---|---|
| 24 + 20 + 16 + 26 + 12 (= 98) or 12 × 8 + 2 (= 98) | M1 |
| No and 98 seen | A1 |
| (2) | |
| (6 marks) |
Notes
A1: Must see “No” or “Not correct”, “Wrong” etc.
The general guidance for this paper says a correct answer, unless obtained from an incorrect method, implies a correct method, except in Q2 where the mark scheme states otherwise: in (d) “98” must be seen.