
Higher June 2023 Paper 1R Q22
22 Some people attend a concert.
The histogram shows information about the ages of these people.
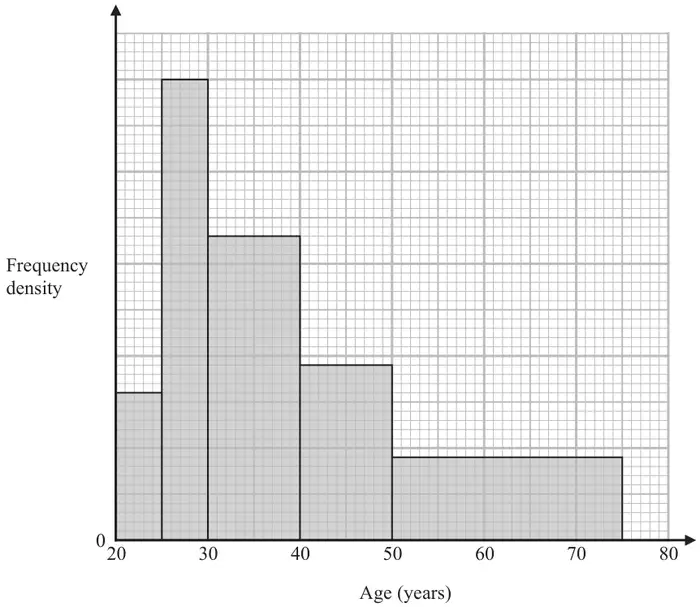
Work out an estimate for the percentage of these people who are aged more than 55 years.
Give your answer correct to one decimal place.
(4)
| Scheme | Marks |
|---|---|
| e.g. 20 × 9 (= 180) or 20 × 0.9 (= 18) or 20 × 1.8 (= 36) or (4 × 25) + (4 × 20) (= 180) oe or 4 × 0.9 (= 3.6) or 4 × 1.8 (7.2) | M1 |
| e.g. 5 × 16 + 5 × 50 + 10 × 33 + 10 × 19 + 25 × 9 (= 1075) or 5 × 1.6 + 5 × 5 + 10 × 3.3 + 10 × 1.9 + 25 × 0.9 (= 107.5) or 5 × 3.2 + 5 × 10 + 10 × 6.6 + 10 × 3.8 + 25 × 1.8 (= 215) or (3×25 + 5) + (10×25) + (12×25 + 2×15) + (6×25 + 2×20) + (5×25 + 5×20) (= 1075) or 1 × 1.6 + 1 × 5 + 2 × 3.3 + 2 × 1.9 + 5 × 0.9 (= 21.5) or 1 × 3.2 + 1 × 10 + 2 × 6.6 + 2 × 3.8 + 5 × 1.8 (= 43) | M1 |
e.g. \(\dfrac{180}{1075}(\times 100)\) or \(\dfrac{18}{107.5}(\times 100)\) or \(\dfrac{36}{215}(\times 100)\) or \(\dfrac{3.6}{21.5}(\times 100)\) or \(\dfrac{7.2}{43}(\times 100)\) or 0.167(441…) (× 100) | M1 |
| Correct answer scores full marks (unless from obvious incorrect working) Answer: 16.7 | A1 |
| (4) | |
| (4 marks) |
Notes
M1: for a method to find the area of the 55 - 75 bar
M1: for a method to find the total area
Using 5 bars (products or areas)
eg 80 + 250 + 330 + 190 + 225 or
16 + 50 + 66 + 38 + 45
allow one error or omission
Using 6 bars (products or areas)
eg 80 + 250 + 330 + 190 + 45 + “180” or
16 + 50 + 66 + 38 + 9 + “36”
allow one error or omission
M1: for a method to find a fraction aged 55+ or percentage aged 55+ using all correct values only
A1: awrt 16.7