
Higher June 2024 Paper 1R Q16
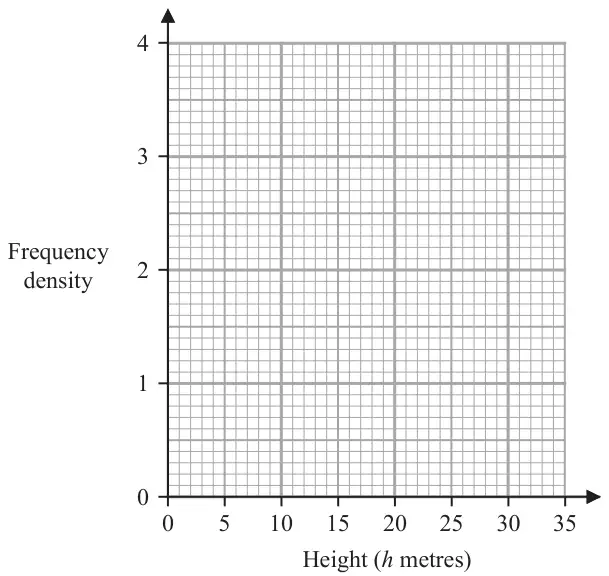
16 The table gives information about the heights, in metres, of the trees in a park.
| Height (\(h\) metres) | Frequency |
|---|---|
| \(0 \lt h \leqslant 2\) | 5 |
| \(2 \lt h \leqslant 5\) | 12 |
| \(5 \lt h \leqslant 10\) | 18 |
| \(10 \lt h \leqslant 20\) | 14 |
| \(20 \lt h \leqslant 35\) | 9 |
On the grid, draw a histogram for this information.
(3)
| Scheme | Marks |
|---|---|
| 5 ÷ 2 (= 2.5) oe 12 ÷ 3 (= 4) 18 ÷ 5 (= 3.6) oe 14 ÷ 10 (= 1.4) oe 9 ÷ 15 (= 0.6) oe | M1 |
| M1 | |
| Correct answer scores full marks (unless from obvious incorrect working) Answer: completely correct histogram | A1 |
| (3) | |
| (3 marks) |
Notes
M1: for 3 correct frequency densities or 3 correct bars
M1: for 4 correct frequency densities or 4 correct bars
A1: completely correct histogram
use overlay
SC: award B2 for all 5 bars of correct width with heights in the correct ratio (eg drawn at 1.25, 2, 1.8, 0.7, 0.3)