
Foundation June 2023 Paper 2R Q6
6 Tamzin recorded the colour of each of the cars she saw one afternoon.
She saw only red cars, blue cars, white cars and black cars.
The bar chart gives information about the numbers of red cars, blue cars and white cars that she saw.
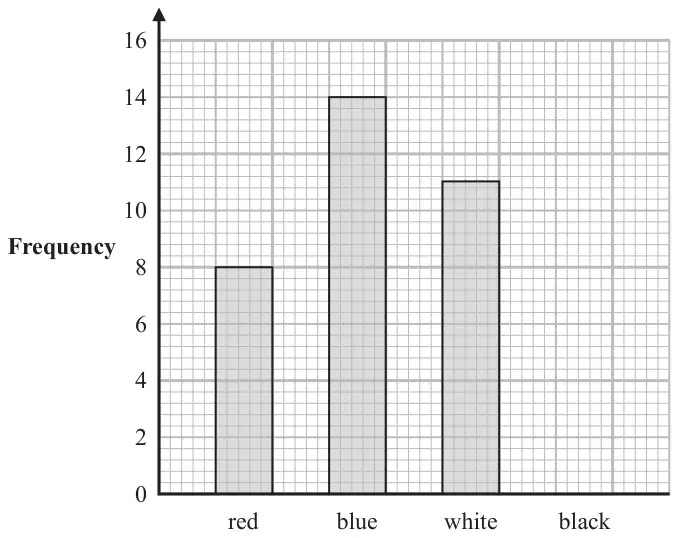
(a) Write down the number of red cars that Tamzin saw. (1)
Tamzin saw 40 cars in total.
(b) Draw a bar on the bar chart to show the number of black cars that Tamzin saw. (3)
| Scheme | Marks |
|---|---|
| 8 | B1 |
| (1) |
Notes
B1: cao
| Scheme | Marks |
|---|---|
| 40 – (“8” + 14 + 11) oe or 40 – 33 or or 18 – 11 or 21 – 14 or 15 – “8” | M1 |
| 7 | A1 |
| Correct answer scores full marks (unless from obvious incorrect working) Answer: Correct height of bar | A1 |
| (3) | |
| (4 marks) |
Notes
M1: for 40 minus their 3 readings (allow one incorrect reading from 8 or 14 or 11)
A1: (ft for 15 – “8” or 40 – (“8” + 14 + 11))
A1: ft dep on M1
± half square tolerance for height of bar
Award 3 marks for a fully correct bar of height of 7