
Foundation June 2023 Paper 1R Q9
9 The pictogram gives some information about the number of cars sold by each of the four employees of Best Cars in April.
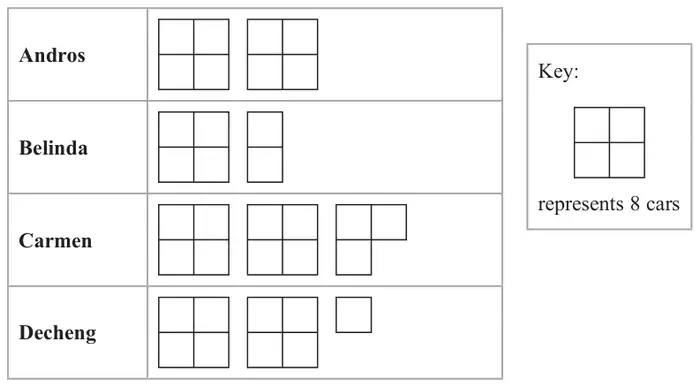
In March, Best Cars sold 60 cars in total.
Its target for April was to sell 15% more cars in total than it sold in March.
Show that Best Cars did not meet its target.
Show your working clearly.
(4)
| Scheme | Marks |
|---|---|
| eg (8 + 8) + (8 + 4) + (8 + 8 + 6) + (8 + 8 + 2) (= 68) or 16 + 12 + 22 + 18 (= 68) or 8.5 × 8 (= 68) | M2 |
| eg 60 × 0.15 (= 9) oe or 60 × 1.15 (= 69) oe | M1 |
| Working required Answer: 68 and 69 or 68 and 1 more needed | A1 |
| (4) | |
| (4 marks) |
Notes
M2: for a method to find the total cars sold in April with at least 3 out of 4 correct and intention to add or sight of 68
(M1 for a method to find the totals for each employee with at least 3 out of 4 correct
OR
method to find the totals for 2 employees and intention to add)
M1: (indep) for a method to increase 60 by 15% or 15% of 60 or sight of 69 or 9
Allow \(\dfrac{\text{“}{68}\text{”}}{1.15}\) (= 59.1...)
A1: Suitable conclusion e.g 59.1 v 60