
Foundation June 2025 Paper 2R Q11
11 The bar chart gives information about the results of the games played by a school team.
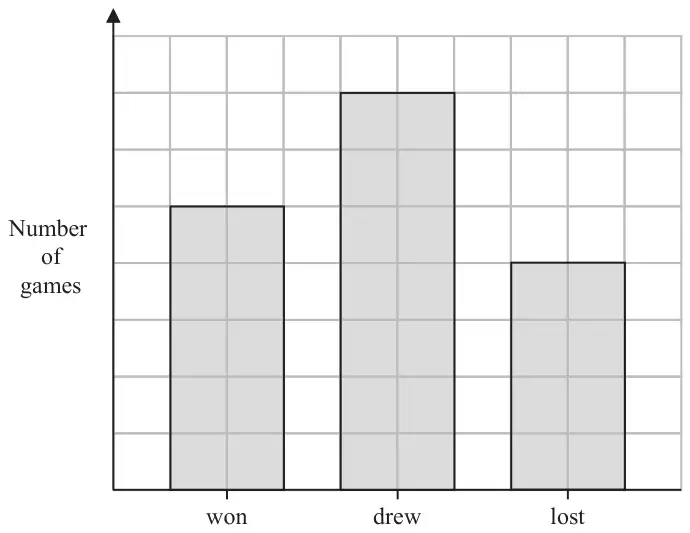
The team gained
3 points for each game it won
1 point for each game it drew
0 points for each game it lost
The team drew 14 games.
Work out the total number of points the team gained.
(3)
| Scheme | Marks |
|---|---|
\(\dfrac{14}{7}\) (= 2) or \(\dfrac{5}{7} \times 14\) (=10) or \(\dfrac{4}{7} \times 14\) (=8) or any correct value marked on the vertical axis | M1 |
| “10” × 3 (=30) or 5 × 3 + 7 × 1 (= 15 + 7 = 22) or 5 × 3 + 14 (= 15 + 14 = 29) | M1 |
| Correct answer scores full marks (unless from obvious incorrect working) Answer: 44 | A1 |
| (3) | |
| (3 marks) |
Notes
M1: for working with the scale
M1: for a method to find the number of points won
or
for a method to work out the total number of points using a vertical scale of 1 game per cm
Note: M0M1 is possible