
Foundation June 2025 Paper 1 Q2
2 The pictogram shows some information about the number of tyres sold in a garage each month from January to April.
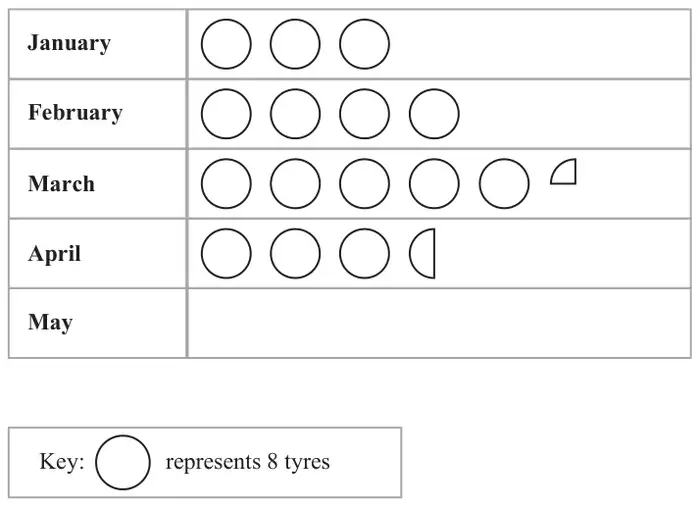
(a) How many tyres were sold in January? (1)
(b) Work out the total number of tyres sold in the four months from January to April. (2)
In May, 22 tyres were sold.
(c) Show this information on the pictogram. (1)
| Scheme | Marks |
|---|---|
| 24 | B1 |
| (1) |
Notes
B1: cao
| Scheme | Marks |
|---|---|
| “24” + 32 + 42 + 28 or 15 × 8 + 4 + 2 oe | M1 |
| 126 | A1 |
| (2) |
Notes
M1: ft their “24”, allow one error or omission in adding values
A1: cao
| Scheme | Marks |
|---|---|
| 2 and ¾ circles | B1 |
| (1) | |
| (4 marks) |
Notes
B1: oe eg 2 and ½ and ¼ circles