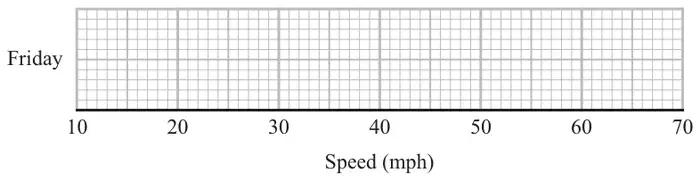
11 Mina records the speeds, in mph, of some cars on a road on Friday. She uses her results to work out the information in this table.
Speed (mph)
Lowest speed
25
Lower quartile
35
Median
40
Interquartile range
12
Range
37
(a) On the grid, draw a box plot to show the information in the table.(3)
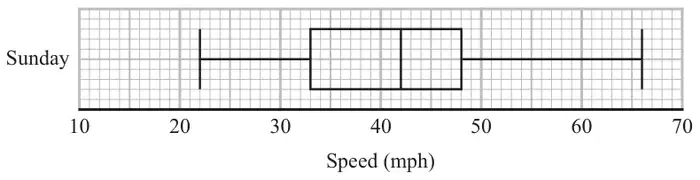
Mina also records the speeds of some cars on the same road on Sunday. She uses her results to draw this box plot.
(b) Compare the distribution of the speeds on Friday with the distribution of the speeds on Sunday. (2)
Mark scheme (a)
Answer
Mark
Mark scheme
Box plot drawn
M1
for method to find UQ (47) or greatest value (62) from the table
M1
for showing a box and at least 3 correctly plotted values from 25, 35, 40, 47, 62
A1
for a fully correct box plot
Additional guidance
May be implied by one of these values being correctly plotted.
Box can be any height. Accept ends that are marked (eg line, cross, dot) or defined by the end of the whiskers if clear
Mark scheme (b)
Answer
Mark
Mark scheme
Comparison
C1
ft a correct comparison of medians from figures, eg the median speed for Sunday was greater than the median speed for Friday or the speed on Friday is generally lower as the median is lower
C1
ft for a correct comparison of spread, eg the (interquartile) range of the speeds for Friday is smaller than the (interquartile) range of the speeds for Sunday, the (interquartile) range on Sunday is larger than the (interquartile) range on Friday Comparisons for this mark can relate to the range or the IQR
Additional guidance
Simply quoting values is insufficient, they must be compared.
Median
Range
IQR
Friday
40
37
12
Sunday
42
44
15
Figures need not be stated but if they are they must be correct.
For 2 marks, at least one comparison must be in context (eg refers to speed or mph)